SUMMARY
I parse HackerNews (HN) “Ask HN: Who is hiring?” posts from 2013 to time of writing and analyse them to better understand the trends in the data job market with a focus on the fate of data science. Here are my main conclusions:
It is likely that the Data Scientist role is in a long term decline and that skills such as data mining and visualisation are also out of favour. I argue from data that the Data Scientist role is poorly differentiated and that its responsibilities are being eroded by better specified roles such as ML Engineer and Data Engineer.
In contrast to the Data Scientist, the ML Engineer role has seen a sustained increase in mentions which is now on par with the Data Scientist role but trending in the opposite direction (upward!). The ML Engineer is positioned as an AI aligned role focused on deploying custom models to production. It is a continuity of the data engineer which, in contrast, is focused on data preparation and other infrastructural concerns.
If you do not have time to read the whole post I suggest skipping to the “Discussion and conclusions” section for a fuller discussion including a caveat emptor section.
MOTIVATION AND INTRODUCTION
I have worked in “big data”, “data science” or something adjacent for around 12 years, and in that time I have observed these fields (and their associated roles) change a lot. I had never thought about it much because it was never very difficult to find work, however, recent times have been a bit different because my neck of the woods – nestled within some subset of “data science” jobs – has been rather quite, and the few jobs popping up have been rather specialised. I would not find the lull concerning – especially given the back drop of an economic down turn – if it wasn’t for a suspicion I’ve had for some time that the field is long overdue a refactoring. Some conjecture:
“Data science” roles are not exchangeable: you couldn’t swap the role description from two companies in the same domain and expect it to approximate the needs of either in most cases.
“Data scientists” are not exchangeable: you couldn’t swap out equally senior data scientists in the same domain and expect to get similar skills.
For most consumers of it, “data science” is a functional requirement, and its commoditisation is strongly desirable.
Granted 1-3 above, the factoring of the “data science” job market into a better defined set of roles for which the converse of 1 and 2 hold, seems all but inevitable. I wanted to investigate whether this was afoot, and if so, to what extent. I decided an exploratory analysis of the job market was in order.
In this post I’m going to be using HN job posting data with a lick of old school NLP and statistics to analyse how noun phrases featuring a controlled list of terms have changed since 2013. I’ll start by explaining the data and how it is processed. I’ll then jump straight into exploratory analysis. Finally, I’ll investigate some specific hypotheses regarding how “data science” and associated roles are defined, and then end with a discussion of the results.
DATA AND PROCESSING
You can download the final processed data used in this portion of the analysis here.
Hacker News is to tech and practice what “Paris fashion week” is to fashion. HN hosts an automated monthly recurring post titled “Ask HN: Who is hiring?” in which hundreds of companies post job opportunities all over the world. As a data source for job postings, it is unlikely that HN is representative of any given IT job market. Those who post are more likely to be start-ups or scale-ups, the tech and mission is likely to be trendy, the base of operation is most likely to be somewhere cool, and so on. However, in so far as HN is an avant-garde community, its adoption of tech and practices likely foreshadow adoption writ large.
Collecting data from HN is easy because they make it available via a free public Firebase API. The common URL prefix for the API is:
https://hacker-news.firebaseio.com/v0All the hiring posts of interests are automatically created on a schedule by a user called “whoishiring”. So I can easily find all these posts using the following endpoint:
/user/whoishiring.jsonThereafter its just a matter of iteratively collecting the top level comments from every “Ask HN: Who is hiring?” post using the /item/{item_id}.json endpoint.
Once the data is collected, I extract all noun phrases matching the following set of constraints:
Must be two words. E.g. data science, ml engineer, ai platform, etc. The main reason is that it becomes exponentially difficult to pair down noun phrases which mean the same thing if they can be any length. E.g. “data engineer” versus “data engineer job”.
The first word must be in the following list: statistical, deeplearning, data, nlp, llm, mlops, ai, ml. Note that the expansions of the acronyms are reduced to acronyms in the text prior to this stage.
The second word must be a noun.
In the code below “pairs” is the operative function. Note that I also do some adhoc contraction of phrases into their standard acronyms or forms to reduce the incidence of terms which mean the same but have different names.
import json, re, nltk

CTRL=[
  "statistical", "deeplearning",
  "data", "nlp", "llm",
  "mlops", "ai", "ml"]

ZAP=[
  ("scientists", "scientist"),
  ("engineers", "engineer"),
  ("analysts", "analyst"),
  ("researchers", "researcher"),
  ("large +language +model(s*)", "llm"),
  ("natural +language +processing","nlp"),
  ("deep +learning", "deeplearning"),
  ("artificial +intelligence", "ai"),
  ("ai +ai", "ai"),
  ("machine +learning", "ml"),
  ("machinelearning", "ml"),
  ("ml +ai", "ml"),
  ("ai +ml", "ml")]

def is_noun(w):
  w = nltk.word_tokenize(w)
  w = nltk.pos_tag(w)
  return w[0][1].startswith('NN')

def pairs(txt):
  txt = txt.replace("\n"," ")
  txt = re.sub(r"\<.+?\>"," ",txt.lower())
  txt = re.sub(r"\&[a-zA-Z0-9#]{1,5};"," ",txt)
  txt = re.sub(r"[^A-Za-z0-9 ]"," ",txt)
  for k,v in ZAP:
    txt = re.sub(k, v, txt)
  txt = re.split(" +", txt)
  txt = [t for t in txt if t]
  for a,b in zip(txt[:-1], txt[1:]):
    if a in CTRL and is_noun(b):
      yield a, b
I run each comment through the “pairs” function, collect the unique noun phrases, add the comments timestamp and save it into the CSV file available for download above. I also add a few convenient fields used later (such as year). The final table looks like this:
## # A tibble: 56,481 × 5
##          time  year root        next.         term
##         <int> <int> <chr>       <chr>         <chr>
##  1 1354374283  2012 data        hero          data hero
##  2 1354375006  2012 statistical analysis      statistical analysis
##  3 1354378098  2012 data        analysis      data analysis
##  4 1354378098  2012 data        systems       data systems
##  5 1354378098  2012 data        visualization data visualization
##  6 1354378427  2012 data        sets          data sets
##  7 1354379964  2012 data        analyst       data analyst
##  8 1354382106  2012 data        analyst       data analyst
##  9 1354383248  2012 data        scientist     data scientist
## 10 1354383248  2012 data        engineer      data engineer
## # ℹ 56,471 more rows
There are 56481 rows, and 3479 unique terms. The terms are distributed as follows across years.
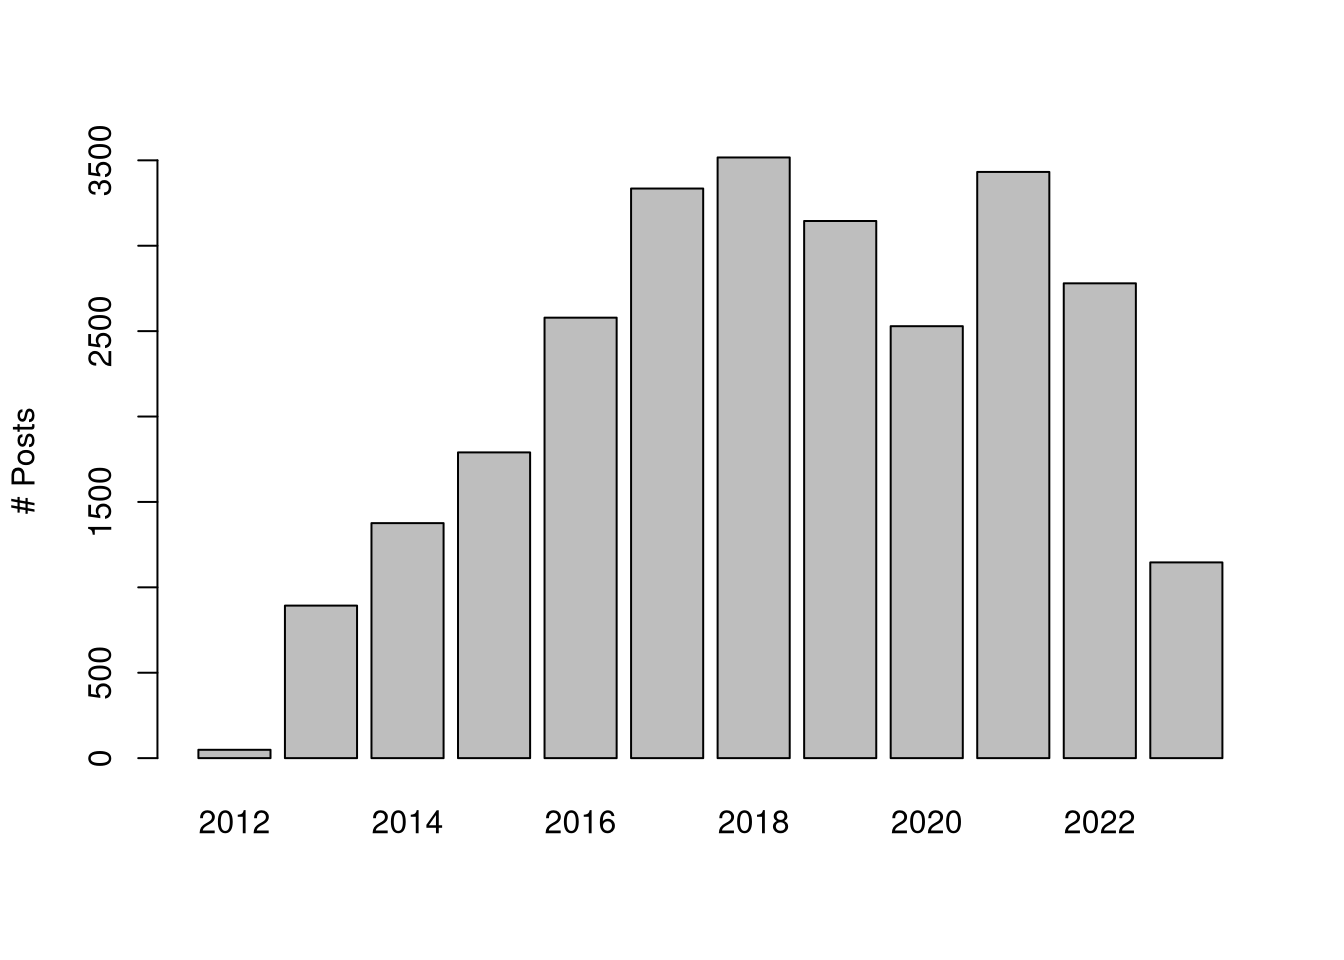
Figure 1: Distribution of job posts over time.
My main analytical artefact is the year/term cross tabulation of occurrences normalised by yearly totals. It can be calculated like this:
crosstab <- read.csv("data/compile.csv") %>%
  filter(year > 2012) %>%
  { table(.$year, .$term) } %>%
  { sweep(., 1, rowSums(.), "/") }
Note that I remove posts prior to 2013 since there are too few to represent the year.
ANALYSIS
Directions of change
There are a large number of spurious and uncommon terms in the cross-tabulation above. A useful way of cutting through the noise is to imagine the data as residing in a high dimensional space (wherein each term is a dimension of each year), and then considering along which axes the data tends to vary most; otherwise known as principal component analysis (PCA). There are however two problems with using PCA in this example:
Principal components (PCs) are not easy to interpret especially when the principal vectors are as long as they are here.
The fitting procedure is sensitive to outliers, and outliers (particularly large fractions in this case) are likely in this sort of analysis due to happenstances of parsing text.
I can remedy (1) by using sparse PCA (PCA with regularisation) to reduce PC vectors to just a few non-zero components, and I can remedy (2) by using a fitting procedure for sparse PCA robust to outliers. It is trivial to implement in R as follows:
require(sparsepca)## Loading required package: sparsepcapca <- robspca(crosstab, k=5, verbose=F, alpha=1e-2)
row.names(pca$loadings) <- colnames(crosstab)
summary(pca)## PC1 PC2 PC3 PC4 PC5
## Explained variance 0.001 0.001 0.000 0.000 0.000
## Standard deviations 0.036 0.027 0.008 0.007 0.006
## Proportion of variance 0.518 0.294 0.027 0.020 0.016
## Cumulative proportion 0.518 0.812 0.838 0.858 0.874Note that despite the huge number of terms, over 80% of the variance can be explained in just two components. The non-zero constituents of the first PC are:
pca$loadings[,1][pca$loadings[,1]!=0] %>% round(2)## data mining data visualization ml engineer
## -0.11 -1.07 1.11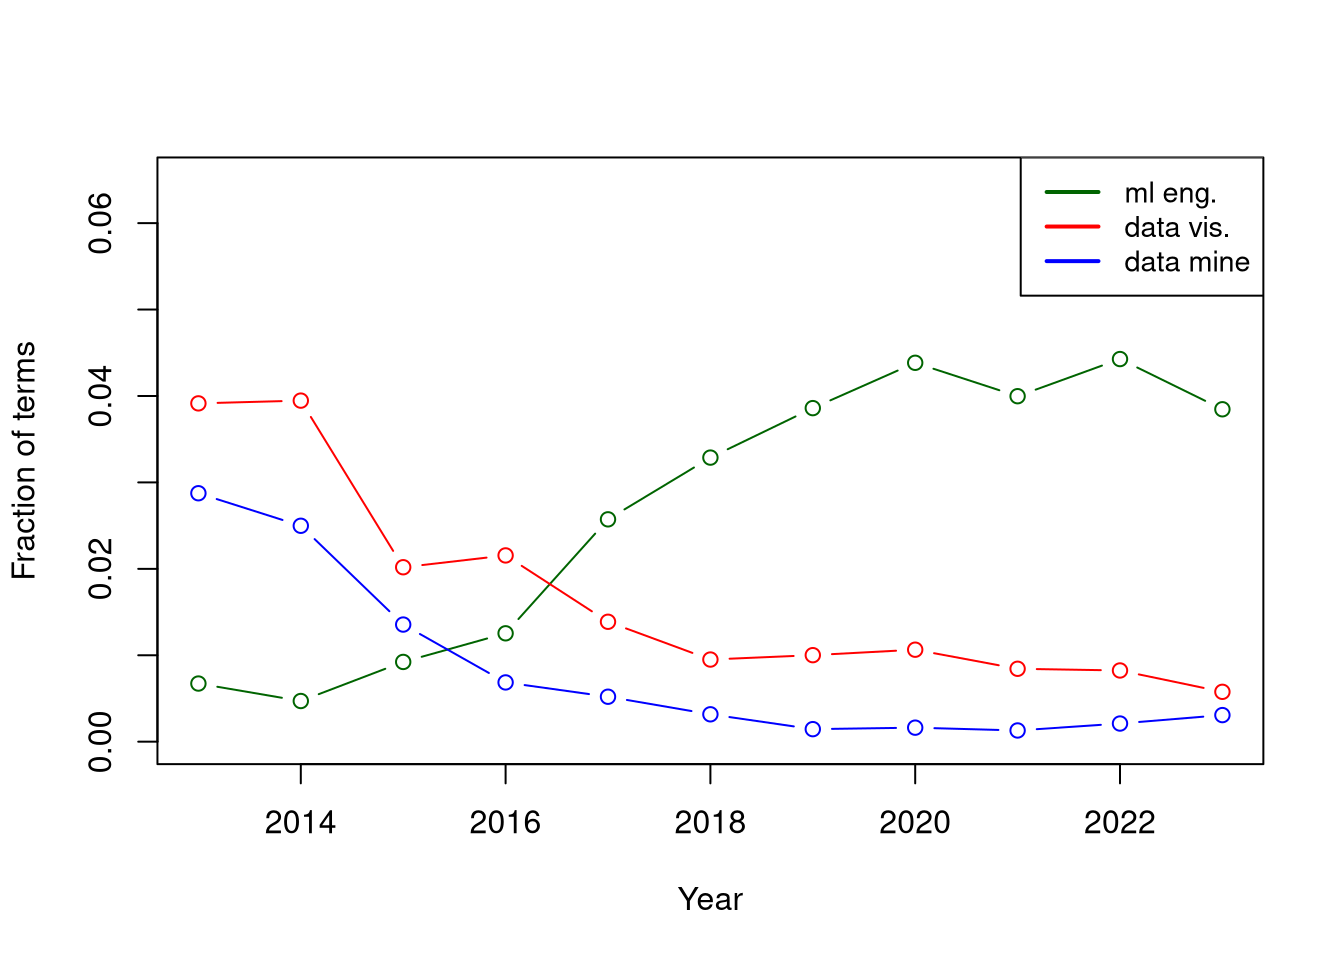
Figure 2: Term trends over time for the non-zero loadings of the first principal component account for over 50% of explained variance.
I can similarly investigate the second principal component which accounts for a further \(\sim 30\)% explained variance.
pca$loadings[,2][pca$loadings[,2]!=0] %>% round(2)## data scientist ml engineer
## -1.09 0.11It is positively aligned with “ml engineer” but much more strongly negatively aligned with “data scientist”. As before I visualise the series (below) and confirm that there are clear trends in both. Note the peak at which the “data scientist” term starts and where it ends up!
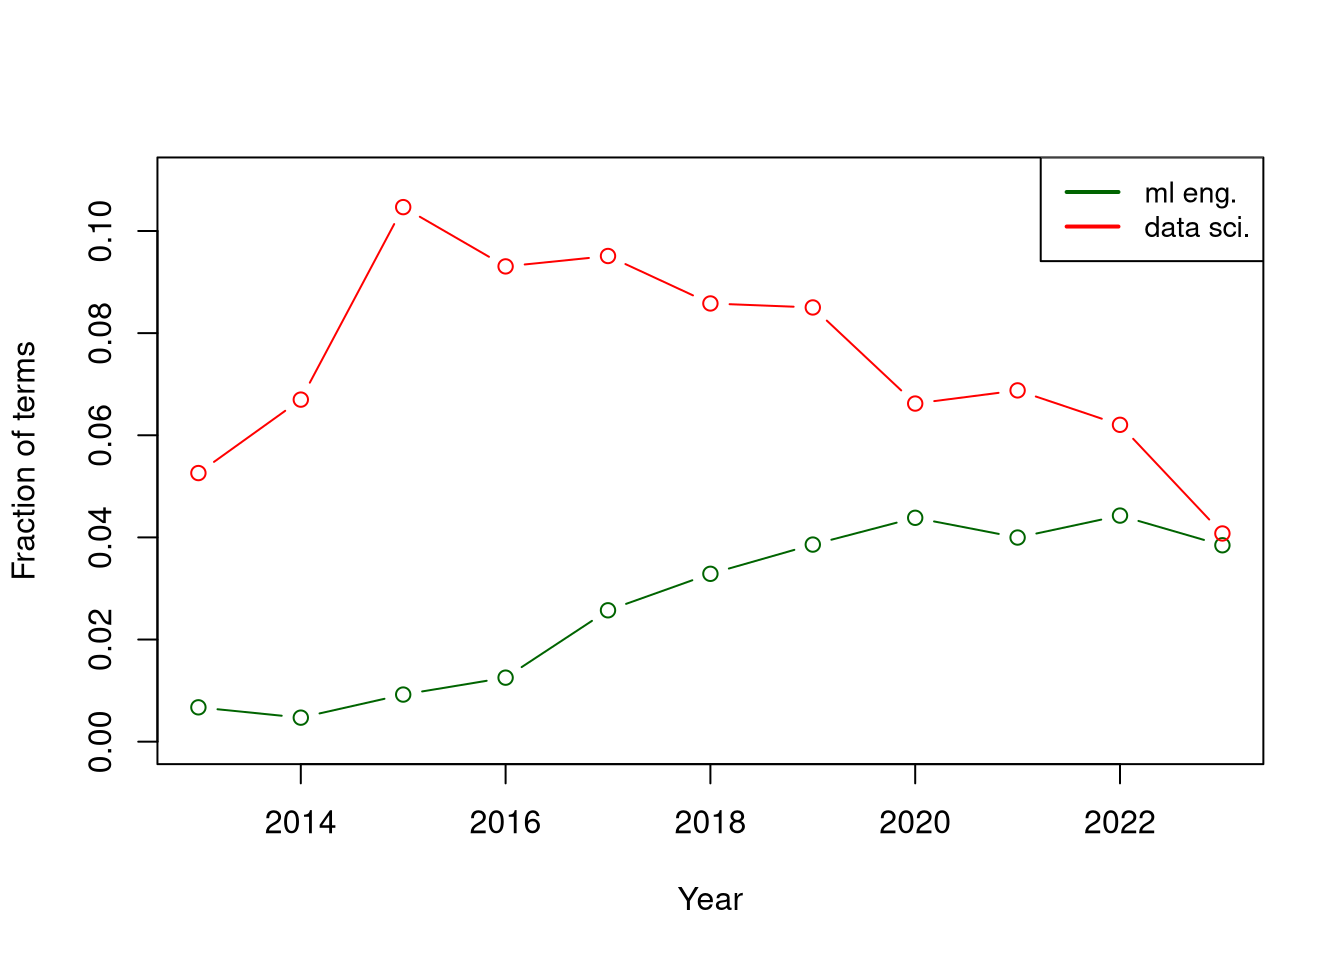
Figure 3: Term trends over time for the non-zero loadings of the second principal component account for about 30% of explained variance.
Role definitions
In the following analysis I define three response terms related to whether a post contains mention of ML Engineer, Data Engineer and Data Scientist respectively. I’ve added the Data Engineer role into considerations because I am curious about how it is distinguished from the ML Engineer. I also define a collection of other terms that I think should distinguish the data scientist from the others. That is, I expect that the engineering roles will be more closely associated with the infrastructure and concepts, whilst the data science role will be more associated with the verbs and artefacts. The dataset is implemented as follows:
txt   <- read.csv("data/texts.csv")$txt

dt <-
  tibble(

    # Response
    is_ml = grepl("(ml|machine learning) engineers*($|[^a-z0-9])", txt),
    is_de = grepl("data engineers*($|[^a-z0-9])", txt),
    is_ds = grepl("data scientists*($|[^a-z0-9])", txt),

    # Concepts
    AI = grepl(" ai |artificial intelligence", txt),

    # Infrastructure
    pipeline = grepl("pipeline", txt),
    deploy   = grepl("deploy", txt),
    cloud    = grepl("cloud", txt),
    infra    = grepl("infrastructure", txt),
    dataset  = grepl("dataset|data set", txt),

    # Verbs
    analyse   = grepl("analy[sz]", txt),
    optimize  = grepl("optimi[sz]", txt),
    visualize = grepl("visuali[sz]", txt),
    decide    = grepl("decision|decide", txt),
    explore   = grepl("explor", txt),
    research  = grepl("research", txt),
    discover  = grepl("discover", txt),
    mine      = grepl("mining|mine", txt),

    # Artefacts
    insight    = grepl("insight", txt),
    experiment = grepl("experiment", txt),
    model      = grepl("model", txt)

) %>% filter(is_ml | is_ds | is_de)
Note that the data is filtered for recency to include only posts since 2021, in which period there are 681 posts mentioning “ML Engineer”, 1197 mentioning “Data Engineer” and 1020 mentioning “Data Scientist”. I’ll now model each response using a logistic regression to get some sense of how terms line up with roles.
ML Engineer
The ML Engineer is the role most closely positively aligned with “AI”, “deployment”, “experimentation”, “research” and “modelling”. It is negatively aligned with “pipeline”, “infrastructure” and “analysis”. This fits the impression that ML Engineer is the new role most aptly aligned to “AI” which emphasises above all the deployment of custom models to production.
glm(is_ml ~ . -is_ds -is_de, data=dt, family=binomial) %>%
  summary()
##
## Call:
## glm(formula = is_ml ~ . - is_ds - is_de, family = binomial, data = dt)
##
## Coefficients:
## Estimate Std. Error z value Pr(>|z|)
## (Intercept) -1.50220 0.07831 -19.184 < 2e-16 ***
## AITRUE 1.57483 0.11298 13.939 < 2e-16 ***
## pipelineTRUE -0.65204 0.20284 -3.215 0.001307 **
## deployTRUE 0.98356 0.15669 6.277 3.45e-10 ***
## cloudTRUE 0.19663 0.13984 1.406 0.159691
## infraTRUE -0.65800 0.15324 -4.294 1.76e-05 ***
## datasetTRUE -0.01751 0.23005 -0.076 0.939336
## analyseTRUE -0.81394 0.16136 -5.044 4.55e-07 ***
## optimizeTRUE -0.54522 0.22832 -2.388 0.016942 *
## visualizeTRUE -0.46430 0.28715 -1.617 0.105898
## decideTRUE -0.04420 0.21752 -0.203 0.838986
## exploreTRUE -0.94946 0.42975 -2.209 0.027152 *
## researchTRUE 0.58429 0.12700 4.601 4.21e-06 ***
## discoverTRUE 0.27907 0.21526 1.296 0.194823
## mineTRUE -0.30678 0.49821 -0.616 0.538048
## insightTRUE 0.03740 0.19834 0.189 0.850425
## experimentTRUE 1.95033 0.26226 7.437 1.03e-13 ***
## modelTRUE 0.49789 0.14574 3.416 0.000635 ***
## ---
## Signif. codes: 0 '***' 0.001 '**' 0.01 '*' 0.05 '.' 0.1 ' ' 1
##
## (Dispersion parameter for binomial family taken to be 1)
##
## Null deviance: 2899.2 on 2454 degrees of freedom
## Residual deviance: 2428.3 on 2437 degrees of freedom
## AIC: 2464.3
##
## Number of Fisher Scoring iterations: 5Data Engineer
The Data Engineer is the role most closely positively aligned with “data mining”, “cloud”, “infrastructure” and “pipeline”. It is negatively aligned with “AI”, “discovery”, “experimentation” and “modelling”. This fits the impression that a Data Engineer is largely an infrastructural role.
glm(is_de ~ . -is_ds -is_ml, data=dt, family=binomial) %>%
  summary()
##
## Call:
## glm(formula = is_de ~ . - is_ds - is_ml, family = binomial, data = dt)
##
## Coefficients:
## Estimate Std. Error z value Pr(>|z|)
## (Intercept) 0.16811 0.06303 2.667 0.007651 **
## AITRUE -1.05108 0.11235 -9.356 < 2e-16 ***
## pipelineTRUE 0.41964 0.15224 2.756 0.005843 **
## deployTRUE -0.15895 0.14599 -1.089 0.276229
## cloudTRUE 0.67076 0.12211 5.493 3.95e-08 ***
## infraTRUE 0.31841 0.11764 2.707 0.006796 **
## datasetTRUE -0.41583 0.20718 -2.007 0.044741 *
## analyseTRUE -0.01336 0.11688 -0.114 0.908985
## optimizeTRUE -0.25130 0.18746 -1.341 0.180068
## visualizeTRUE -0.41398 0.23209 -1.784 0.074473 .
## decideTRUE 0.06901 0.18210 0.379 0.704691
## exploreTRUE 0.33694 0.31087 1.084 0.278436
## researchTRUE -0.12425 0.11725 -1.060 0.289316
## discoverTRUE -0.64970 0.20558 -3.160 0.001575 **
## mineTRUE 1.66962 0.39846 4.190 2.79e-05 ***
## insightTRUE 0.08239 0.17255 0.477 0.633023
## experimentTRUE -1.12961 0.28763 -3.927 8.59e-05 ***
## modelTRUE -0.48789 0.13809 -3.533 0.000411 ***
## ---
## Signif. codes: 0 '***' 0.001 '**' 0.01 '*' 0.05 '.' 0.1 ' ' 1
##
## (Dispersion parameter for binomial family taken to be 1)
##
## Null deviance: 3401.8 on 2454 degrees of freedom
## Residual deviance: 3138.4 on 2437 degrees of freedom
## AIC: 3174.4
##
## Number of Fisher Scoring iterations: 4Data Scientist
The Data Scientist is only closely aligned with “analysis”. It is only negatively aligned with “cloud”, “data mining”. Perhaps more surprisingly it is not distinguished by terms such as “research”, “experimentation”, “decision”, “insight”, “discovery”, “visualisation” and so on.
glm(is_ds ~ . -is_ml -is_de, data=dt, family=binomial) %>%
  summary()
##
## Call:
## glm(formula = is_ds ~ . - is_ml - is_de, family = binomial, data = dt)
##
## Coefficients:
## Estimate Std. Error z value Pr(>|z|)
## (Intercept) -0.39486 0.06296 -6.272 3.56e-10 ***
## AITRUE -0.10060 0.10501 -0.958 0.338043
## pipelineTRUE -0.14751 0.14757 -1.000 0.317521
## deployTRUE -0.15263 0.14444 -1.057 0.290642
## cloudTRUE -0.39824 0.12114 -3.288 0.001010 **
## infraTRUE -0.07645 0.11482 -0.666 0.505506
## datasetTRUE 0.35528 0.18941 1.876 0.060687 .
## analyseTRUE 0.42458 0.11300 3.757 0.000172 ***
## optimizeTRUE -0.15792 0.17764 -0.889 0.374016
## visualizeTRUE 0.53357 0.21880 2.439 0.014742 *
## decideTRUE 0.12115 0.17523 0.691 0.489323
## exploreTRUE 0.33444 0.30234 1.106 0.268643
## researchTRUE -0.12752 0.11464 -1.112 0.265984
## discoverTRUE 0.44181 0.18780 2.353 0.018646 *
## mineTRUE -1.53762 0.43302 -3.551 0.000384 ***
## insightTRUE 0.33272 0.16327 2.038 0.041571 *
## experimentTRUE 0.17052 0.22946 0.743 0.457401
## modelTRUE 0.22076 0.12919 1.709 0.087503 .
## ---
## Signif. codes: 0 '***' 0.001 '**' 0.01 '*' 0.05 '.' 0.1 ' ' 1
##
## (Dispersion parameter for binomial family taken to be 1)
##
## Null deviance: 3332.9 on 2454 degrees of freedom
## Residual deviance: 3243.0 on 2437 degrees of freedom
## AIC: 3279
##
## Number of Fisher Scoring iterations: 4DISCUSSION AND CONCLUSIONS
It serves to start with the caveat emptor. The study relies on HN being a fairly accurate bellweather for trends in IT practices broadly. I think this is the case but herein it is stated without evidence. Throughtout the study period there are posts missing (for reasons unknown to me) which may therefore under represent those months. I have no idea whether the proportions of roles hired is very seasonal, but I rely on it not being the case in light of missing months. Further, the last year or two have seen a general global economic downturn. This may change the proportions of roles companies are hiring for, which may inflate/deflate figures in 2022/2023 which may not hold in the longer run.
There are also more technical problems. The data processing heavily leans on NLP and the extraction of noun phrases constrained around a short control vocabulary. Missing out key terms, or just failing to parse the text properly may change the relative distribution of terms. Besides this, many companies post frequently, and many posts contain multiple roles in the same text which will likely contribute to the confounding of terms with roles.
Bare in mind also that this is more of an intelligence analysis which uses some statistics, the implication being that the judgment rests on the consilience of the conclusions herein with those from other sources, rather than the power and correctness of the study.
With the caveats out of the way. I’d reason about the results as follows in so far as it pertains to my original objective of better understanding what is happening with the data science job market.
1. Data science is in decline and vaguely defined
It is likely that the Data Scientist role is in a long term downward trend and that skills such as data mining and visualisation are also out of favour. This is evidenced by a consistent downward slope for the term “data scientist” since 2015, whilst other data roles retained or increased their share of mentions as shown in the plot below.
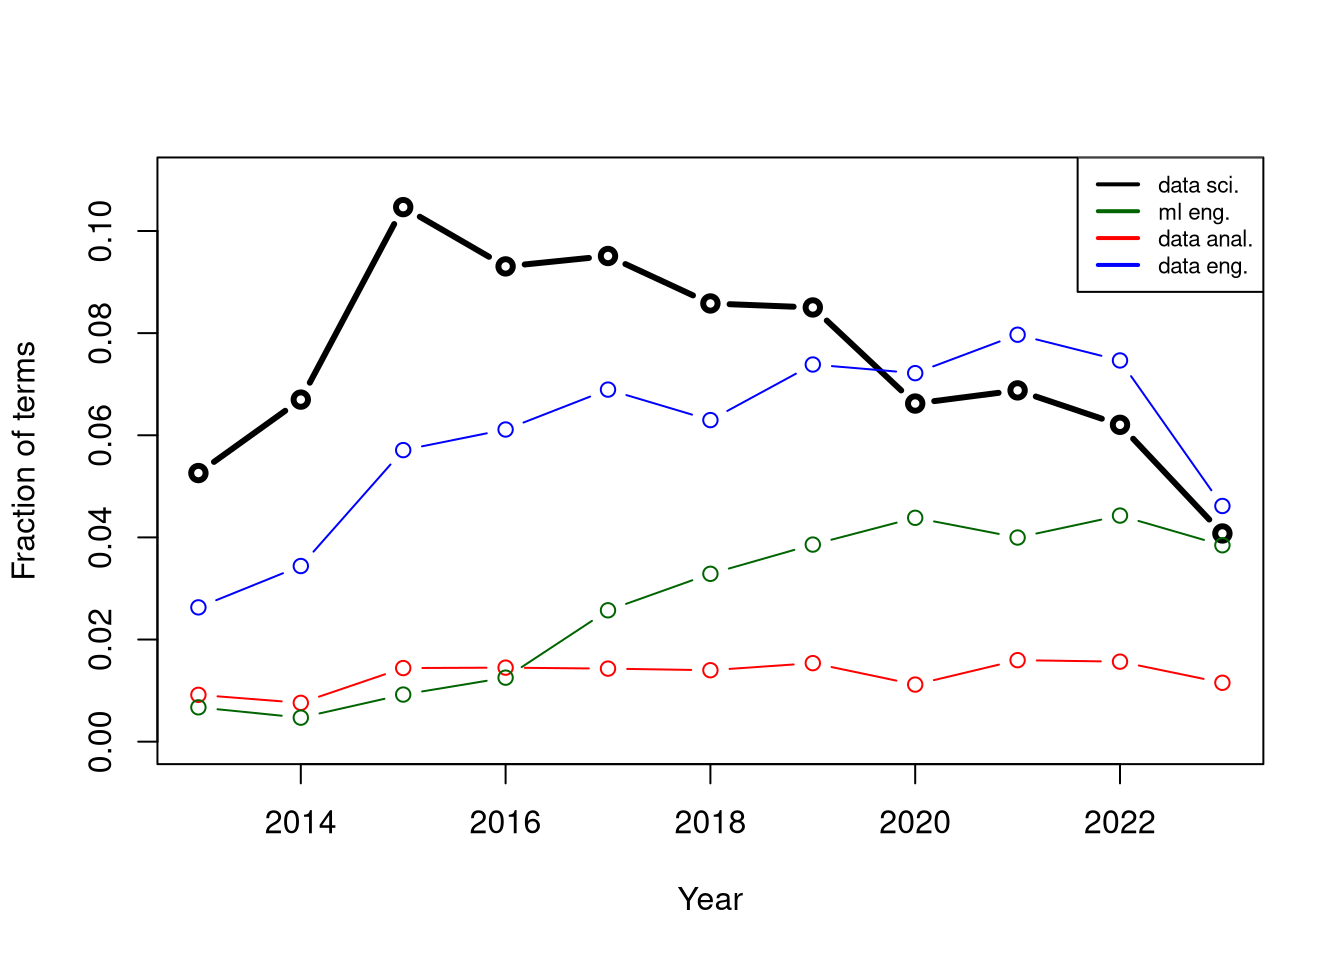
Figure 4: Data scientist role over time in contrast to other data jobs.
Further, the second principal component which accounts for about 30% of explained variance is associated mostly with the “data scientist” term making the case that (1) it is a significant HN trend (i.e. the correlation structure of other terms align with it), (2) it is relatively orthogonal to other changes (in terms of direction of variance, not trend) and (3) it is outsized in comparison to other trends.
In contrast to the ML/Data Engineer role, the Data Scientist role is difficult to distinguish. Of the terms which I had tried, the Data Scientist is only closely aligned with “analysis”, but not with “research”, “experimentation”, “decision”, “insight”, “discovery”, “visualization” and so on. I speculate that the Data Scientist role was more of a catch all bucket which encompassed data engineering, deployment and other responsibilities, and now that better aligned roles are are being sought after, there is less work for data scientists to do.
Finally, the Data Scientist role doesn’t appear to be aligned with “artificial intelligence” related terms. In so far as these are poised to define how data roles are marketed, I would take this to be another negative indicator for the prospect of the data science role.
2. The ML Engineer is up and coming, AI aligned and better specified
It is likely that the ML Engineer role has seen a sustained increase in demand which is now on par with “Data Scientist” (as a fraction of mentions) but trending in the opposite direction (upwards). This is evidenced in the plots above but also in that the trend when combined with changes in “data visualization” and “data mining” accounts for more than 50% of explained variance. I.e. it is a significant trend for the correlation structure of all terms considered.
Much like the Data Engineer role, the ML Engineer is fairly well defined. It is closely positively aligned with “AI”, “deployment”, “experimentation”, “research” and “modelling”, but unaligned with data engineering and data science terms such as “pipeline”, “infrastructure” and “analysis”. I therefore suspect that ML Engineers will specialise towards the training of custom models and their deployment to production.